
General
The Box & Whisker Plot: Seeing Your Data's Story at a Glance
🔒 This content is locked
Unlock for $1.00 to view the full pdf.
Log in to purchaseA visual, from-zero guide to quantiles, percentiles, and box plots — starting with a short history of the chart and the real meaning of "teaching," then building the five-number summary, a full worked example, real-world applications from a single classroom to global science, and homework to practice with.
Related

PDF
$3.00
General
Statistics Officer Recruitment Question Bank: Global Edition
30 views
Nov 01, 2026
PDF
$1.00
General
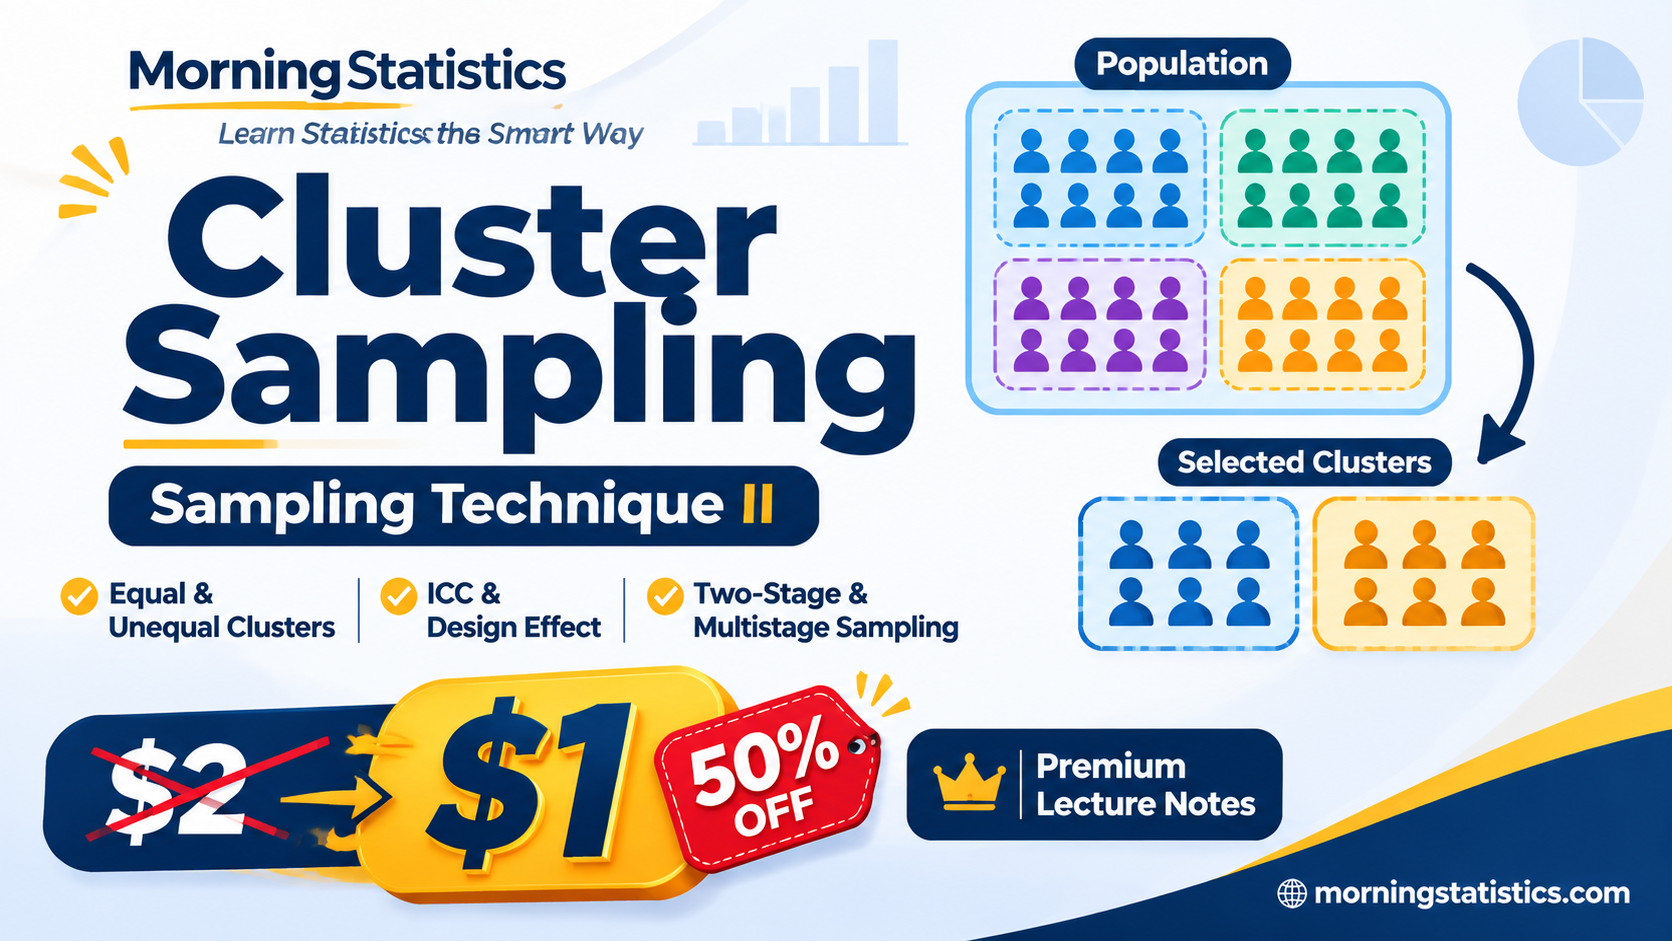
Cluster Sampling Lecture Notes: Equal, Unequal, ICC & Two-Stage Sampling
31 views
Oct 30, 2026
PDF
$2.00
General
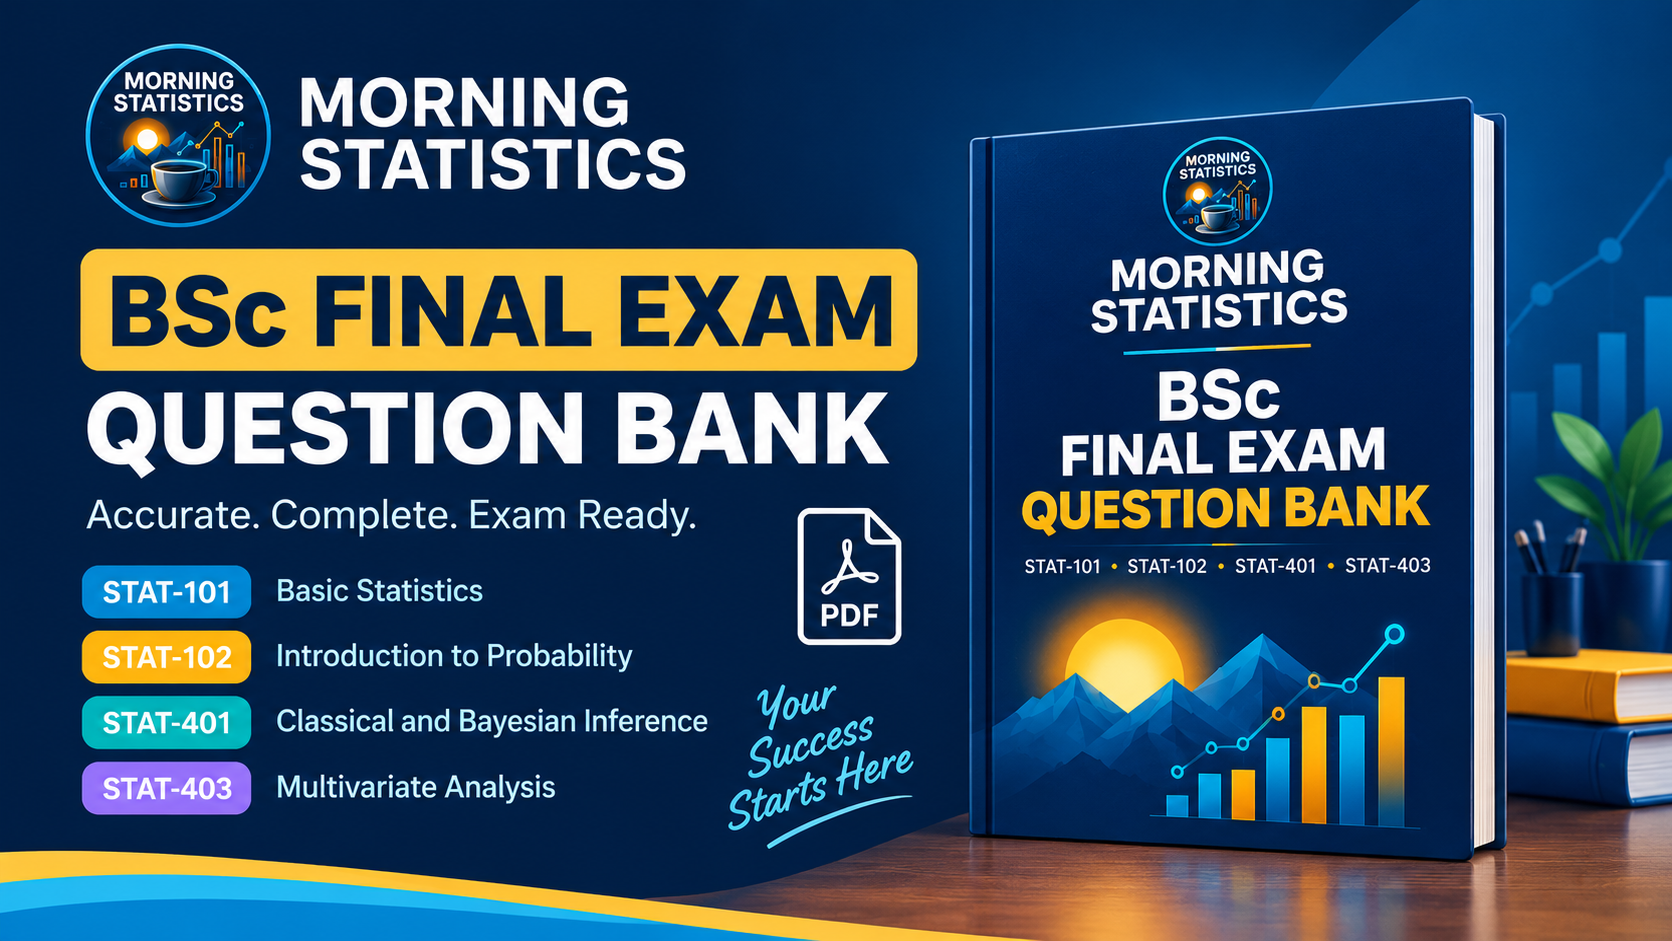
Morning Statistics Question Bank: BSc Final Exam Series
608 views
Oct 12, 2026
PDF
$1.00
General
Multivariate Analysis — Final Exam Question
101 views
Oct 12, 2026